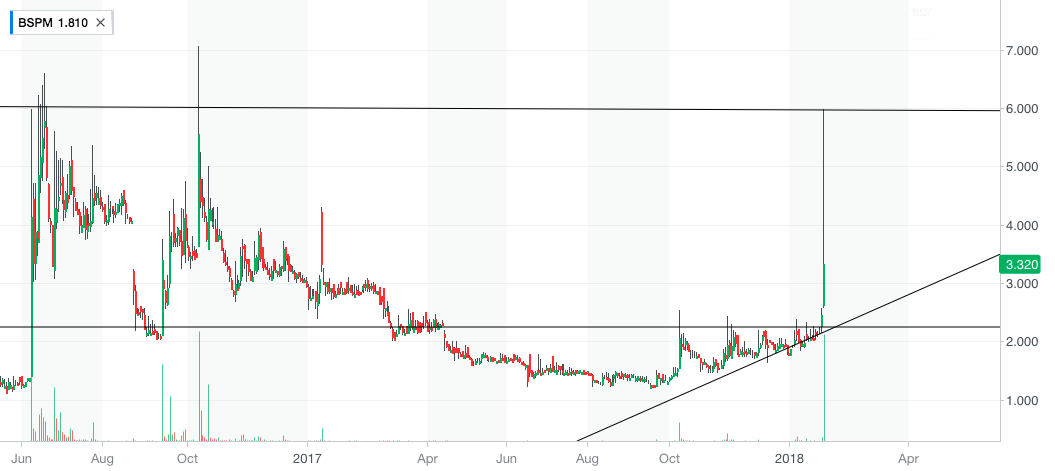
I found this chart on finviz two days prior. It had everything that I look for in a potential trade low float stock in a potential breakout position trending in a direction according to the chart. This was a preemptive strike. I got long at 2.8 s near the breakout point and held over with a stop in place of course. I was not sure when it was going to break but it was trending and wound pretty tight. I sold following day the plan worked, half at 3.9 other half 4.2's. I drew trend lines so you can see the ascending wedge with a flat top breakout position. Seeing on longterm chart that there was resistance at around upper 5.s and it doesnt hold its highs, you can see by the long wicks on the candles. This is when I knew I would possibly decide to go short and I did in the 5.8s with a 5.9's stop because it looked like it was struggling and getting heavy long story "short" haha, joined the fade and took another 80cents on the share. One of my better trades and very good risk vs reward setups.
Join now or log in to leave a comment